Introduction
When using computers, graphics and texts of all sorts can be processed. It is also possible to re-use existing graphics and texts by means of copying/embedding them to/within another application.
Text can often be copied losslessly as-is. When graphics or special data formats are involved, there is usually no simple means of embedding such material into other contexts.
Hence, there are export functions to create more common formats out of less common ones often at the expense of not being properly editable anymore. As a last resort, there is always a screenshot capability that collects the pixels as displayed on the monitor into an image file that can then be embedded into other contexts such as documents or websites.
One of the problems with screenshots and many other export mechanisms is that they result in a pixel-based representation (bitmap) that cannot be scaled freely anymore. This can lead to the resulting documents looking blurry or otherwise wrongly.
To solve some of these issues, there are vector graphics formats which retain the information about which shapes a graphic consists of. This allows graphics to be scaled as needed and preserves a non-blurry display.
Unlike pixel-based bitmaps, the tools for processing vector graphics are known less.
There is also an inherent issue in that there is more ambiguity in handling shapes rather than pixels. A pixel with a color is (except for color profiles) clearly defined. The interpretation of shapes (or even worse: texts) is, however, open to some interpretation: Which shapes are in front of others? How is a specified unit of measure represented on screen or paper? Etc.
Also, the complexity of vector graphics is unrelated to the image’s actual size because more shapes on a small space are more complex than fewer shapes even if they occupy a larger drawing area.
Due to these peculiarities, it can sometimes help to do identity transformations between vector graphics: Exporting them to different formats may change how exactly the shapes are specified and may improve or impede rendering in target programs.
Abstract
This article aims at collecting some techniques for processing vector graphics formats of various sorts and origins. It is focused at making use of existing graphics but references a few applications to create entirely new ones from scratch, too.
Recommended Formats
There are quite a few vector graphics formats out there. Some are not called that but may serve the same purpose.
The following formats are recommended for general use:
- SVG – Scalable Vector Graphics
- PDF – Portable Document Format
Conversion between these formats is possible. One cannot generically recommend one over the other – it depends on what works better with the target application.
For preserving the exact rendering of a file over time, PDF might be a slightly better choice. If the graphics are to be edited after stored in the respective format, SVG is often easier to handle.
Both, SVG and PDF are capable of embedding bitmap graphics. The file format alone is thus not a safe indicator for the image being a vector graphic!
Sometimes, neither SVG nor PDF are available. In these cases, the following alternatives should be considered:
- HTML – Hypertext Markup Language. This is the format used by webpages and it can be rendered to PDF and on many platforms. A HTML export may be a good starting point for further processing.
- PS – Post Script. Nowadays mostly superseded by PDF, a PS file can be converted to PDF very nicely and is hence also a viable format.
- WMF – Windows Metafile. This is the format to export to for embedding graphics in Microsoft Office applications. Stay away from EMF and WMF for other purposes.
- XPS – “Open XML Paper Specification” is a rather rarely seen vector graphics format that can be created on Windows systems. It is recommended to export XPS to PDF whenever possible, because that is easier to work with across multiple platforms.
Note that while SVG and PDF are the recommended vector graphics formats, when creating any new content, you should always keep a copy in the original format because this is the only variant that can be edited truly losslessly.
To Convert between Formats
Inkscape is a very versatile vector graphics handling tool which is also potent for creating new graphics. It can natively edit SVG files and provides a cairo-based as well as an own PDF import mechanism. Although it seems counter-intuitive, the Cairo-based Import often seems to work better.
PDF to SVG
There are multiple ways to convert from an INPUT.pdf to
an OUTPUT.svg:
inkscape               -o OUTPUT.svg INPUT.pdf
inkscape --pdf-poppler -o OUTPUT.svg INPUT.pdf
pdf2svg INPUT.pdf OUTPUT.svg # uses cairo/poppler backend, too!
Other Input File to SVG
Many programs have a native SVG export capability. Whenever this is available, it is preferred. For graphics, the SVG export often offers the advantage of not including any unnecessary whitespace.
For all file type supported by Inkscape, it is often a good choice:
inkscape -o OUTPUT.svg INPUTFILEFor XPS files, there is xpstosvg. Better results can
sometimes be achieved by printing XPS files to PDF under Windows and
afterwards converting to SVG.
xpstosvg INPUT.xps OUTPUT.svg # package libgxps-utilsSVG to PDF
inkscape -o OUTPUT.pdf INPUT.svg
rsvg-convert -f pdf INPUT.svg -o OUTPUT.pdf # package librsvg2-bin
You can also render SVG to PDF using web browsers. In Firefox and Chromium you can either use the native print function or “Print using the system dialog” for potentially different output PDFs.
Note that all web browsers will add whitespace and possibly other noise like page headers/footers, date of printing etc. This makes this technique less convenient than the commands suggested above.
Text to PDF
Recall from the introduction: Text can often be copied losslessly as-is.
Interestingly, while this is true, it is surprisingly difficult to render ASCII art i.e. text documents that represent a graphic by arranging characters such that they produce an image.
Various semi-manual approaches can be taken for this purpose:
- Open text file in a text editor and use the print capability. This often fails due to page boundaries not being large enough. Also, text editors tend to include clutter like line and page numbers which are possibly not wanted for this use case.
- Copy the text into a word processor (Libreoffice Writer, MS Word or similar). This works but requires selecting a suitable font and configuring the page size. One then either needs to store the document with the correct settings or repeat the process for the next export.
- Create a HTML page and render it. This process can actually be
automated. See script
ascii2pdf.shin the repository associated to this page.
Other Input File to PDF
When a PDF export is available from a program, it is a good choice. PDF exports are often print-oriented. Hence, exported graphics often have additional whitespace to make them fit to printable page formats.
Alternatively, Print dialogs are often a means of exporting to PDF. Major web browsers have this capability. Java programs often offer a print to PS which can later be converted to PDF (see above).
For all file types supported by Inkscape, it can be instantiated for this purpose:
inkscape -o OUTPUT.pdf INPUTFILEFor HTML files, it is possible to use Web Browser’s print capability or alternatively the following command-line tool:
wkhtmltopdf INPUT.html OUTPUT.pdfFor PS files, Ghostscript is often a good alternative to Inkscape:
ps2pdf INPUT.ps OUTPUT.pdf # package ghostscriptFor XPS files, there is also an utility:
xpstopdf INPUT.xps OUTPUT.pdf # package libgxps-utilsInput File to WMF
Recommended format for embedding into Microsoft Office Documents.
inkscape               -o OUTPUT.wmf INPUT.svg # if INPUT is SVG
inkscape --pdf-poppler -o OUTPUT.wmf INPUT.pdf # if INPUT is PDF
inkscape               -o OUTPUT.wmf INPUT.pdf # if INPUT is PDF
Other Formats for Vector Graphics in Microsoft Office Documents
MS Office supports two other vector formats besides WMF: EMF and EPS.
While EMF often works worse than WMF (although it is enhanced meta file?), the EPS capability can be a viable choice under very specific circumstances. It requires a registry hack to work: https://support.microsoft.com/en-us/topic/security-settings-for-graphic-filters-for-microsoft-office-365-microsoft-office-2016-microsoft-office-2013-microsoft-office-2010-and-the-2007-microsoft-office-system-8b690e9c-b309-c0ff-1949-e28d04be4c19
Then, one can use EPS files (which can be converted from PS) inside MS Office documents.
Conversion for EPS (rarely useful for other purposes) can be done with inkscape or Ghostscript:
inkscape -o OUTPUT.eps INPUTFILE
ps2eps INPUT.ps OUTPUT.eps # package ps2eps
To perform Identity Transformations
An identity transformation takes one input and produces the same output format. As explained under Introduction, not all vector graphics representations are equal. Hence, an identity transformation can still produce varying outputs.
The following ways have been found to sometimes be effective
(substitute -> by one of the conversion steps from
before):
SVG -> PDF -> SVG
PDF -> SVG -> PDF
PDF -> PS -> PDF
SVG -> PS -> PDF -> SVG # usually not a good idea
The very versatile gs (Ghostscript) command can be used
as a direct identity transformation without intermediate conversion into
a different format. It still produces an output different from the input
file.
The script pdf_reduce_gs.sh (provided in the repository)
makes use of a gs command to attempt to reduce the original
file size as follows:
gs -dBATCH -dNOPAUSE -dNOCACHE -sProcessColorModel=DeviceRGB \
    -dNOOUTERSAVE -sOutputFile=OUTPUT.pdf -dPDFSETTINGS=/prepress \
    -dMonoImageResolution=600 -r150 -dSAFER \
    -dMaxInlineImageSize=16384 -dDetectDuplicateImages \
    -sDEVICE=pdfwrite INPUT.pdf
Variations of this command with fewer arguments may also work, e.g. try:
gs -dBATCH -dNOPAUSE -dNOCACHE -dNOOUTERSAVE -sOutputFile=OUTPUT.pdf \
    -dSAFER -sDEVICE=pdfwrite INPUT.pdf
There is also a tool called svgcleaner for an SVG ->
SVG identity transformation. I have not tried it out yet, but it can be
found here: https://github.com/RazrFalcon/svgcleaner.
To Reassemble existing Graphics
This section collects various means of re-using existing graphics in a range from simple operations like rotation to complex operations like creating a Table of Contents.
Cropping, Rotating, Concatenating, Splitting
For many automated processing tasks, PDF inputs work best. The
following tools can be used entirely from the command-line:
pdfcrop, pdfjam and pdftk.
To cut off whitespace from a PDF, use pdfcrop to produce
file FILE-crop.pdf:
pdfcrop FILE.pdf # package texlive-extra-utilsIn case you need to cut out part of a PDF (and not simply the whitespace around the page), there are two interactive GUI tools for this:
gpdfx-ng. Homepage: https://github.com/yishilin14/gpdfx-ng, Compilation Instructions: https://github.com/m7a/bp-gpdfxpdfscissors. See https://github.com/abdullah-mazed/pdfscissors.
I often use gpdfx-ng and very rarely
pdfscissors because the programs behave a little
differently:
gpdfxextracts data only from a single page and automatically crops it withpdfcrop.pdfscissorsalways operates on all pages and does not reduce the actual data size of the PDF. You should thus not include its output directly into e.g. a LaTeX document because that will cause an unnecessary amount of data to be stored. Also, it is possible for interested persons to recover the original (uncropped) document.
To rotate a PDF, use pdftk or pdfjam
pdftk IN.pdf rotate -east output OUT.pdf  # package pdftk
pdfjam --angle 270 -o OUT.pdf IN.pdf      # package texlive-extra-utils
These two commands are not exactly equal: pdftk does not
add whitespace whereas pdfjam always outputs a page of a
configurable paper size in a configurable orientation, e.g. to
use A4 and landscape mode, amend the call as follows:
pdfjam --angle 270 -o OUT.pdf --paper a4paper --landscape IN.pdfAlso, while pdfjam syntax is rather intuitive with
position independent long and short options, pdftk is
arcane: In the depicted call, the position of arguments is mandatory, as
is the keyword output. Notation -east is not
just “parameter east”, but rather “the entire page range”
(-) concatenated with the direction to rotate
(east).
To concatenate PDFs, the tools can be used as follows:
pdfjam -o OUT.pdf IN1.pdf IN2.pdf
pdfjam -o OUT.pdf IN1.pdf 1-2 IN2.pdf 4,9
pdftk IN1.pdf IN2.pdf cat output OUT.pdf
pdftk A=IN1.pdf B=IN2.pdf cat A1-2 B4,9 output OUT.pdf
The commands can be explained as follows:
- Notation
1-2indicates a page range (from page 1 to page 2 both inclusive) - Notation
4,9indicates a list of pages (include page 4 and 9 only) - The
pdftksyntax withA=andB=assigns these letters to the input files and allows them to be combined arbitrarily after thecat. It is also possible to repeat input files by e.g. specifyingA1-2multiple times there.
Here, too, pdftk retains the input’s paper formats
allowing the concatenation of small and large pages into a single
document. While this can be hard for PDF readers to process properly it
is useful for including large drawings into regular
documents.
Splitting PDFs with pdfjam works as follows:
pdfjam -o OUT1.pdf IN.pdf 1
pdfjam -o OUT2.pdf IN.pdf 2
I.e. by selecting each page once and creating a different output file
for each choice, one can split a PDF into one PDF for each page. This is
a little tedious, though. pdftk can do this automatically
and in a single call:
pdftk IN.pdf burstThis will create pg_0001.pdf, pg_0002.pdf
and so on for each of the input document’s pages and unlike the
pdfjam approach suggested above it will retain the paper
sizes from the original document.
Both, pdfjam and pdftk are very versatile.
The following two subsections detail some special features of these
tools.
Advanced use of
pdfjam: Nup and Scale Operations
pdfjam can be used to place multiple pages on one using
the --nup NxM option. Here,
Nis the horizontal number of pages to put beside each other andMis the vertical number of pages to put above each other
A typical means to place four slides of a presentation on one page for a printout may be using a command like the following:
pdfjam -o print.pdf --nup 2x2 --landscape presentation.pdfIt is important to add the --landscape parameter here
because otherwise the (typically landscape) slides would be allocated a
portrait-format slot on the 2x2 grid that would not be used to its full
extent.
Another option worth noting is the --scale option: It
scales the inputs by the given factor before assembling them for the
output. You can scale down a page to 90% as follows:
pdfjam -o OUT.pdf --scale 0.9 --paper a4paper IN.pdf--scale can be combined with --nup to
achieve print layouts that have enough whitespace for being printed on
typical non-borderless office printers. For that purpose, scales between
0.95 and 0.98 tend to work well.
A command with 0.95 scaling and 2x2 slides on a page could be as follows:
pdfjam -o print.pdf --scale 0.95 --nup 2x2 --landscape presentation.pdfNote that this not only adds space at the output page border but also between the slides on the page. If the space between the slides is unwanted, perform a two-pass operation as follows:
pdfjam -o tmp.pdf --nup 2x2 --landscape presentation.pdf
pdfjam -o print.pdf --scale 0.95 --landscape tmp.pdf
This way, whitespace will only be added to the edges of the actual
printed page, and not between the slides. Of course, by adding a
--scale option to the first operation, too, you can
fine-tune the space between slides and to the border of the paper.
Advanced
use of pdftk: Shuffle, Remove XMP and Stamp Operations
shuffle- Shuffle assembles a single PDF from multiple inputs by taking all first pages, then all second pages, then all third pages etc. after each other. Say, you have a PDF with all “left-hand” pages and another PDF with all “right-hand” pages. Then you can use this feature to bring them back in order.
drop_xmp- This can be used to remove metadata. XMP metadata may reveal sensitive information such as the user name of the person who exported the document or the actual software version in use for the export.
stamp/background- This can be used to overlay/underlay a specific PDF above/below an existent one. This feature is nice for adding page numbers to documents which otherwise don’t have them or to add a common logo onto all of the pages.
Example Script for Background Stamping
This shows the interaction of burst/background/output to edit all
pages of a PDF individually and add a background (taken from
fglayer.pdf) to all pages taken from
merged.pdf producing the output file
merged2.pdf.
# Split into multiple files with prefix by number
pdftk fglayer.pdf burst output split_intermediate/%04d.pdf
pdftk merged.pdf  burst output split_intermediate/%04d_bg.pdf
# Process Add `bg` to `fglayer` PDFs and produce result pdfs (`_rs`)
for i in split_intermediate/????.pdf; do \
    fn="$(echo "$i" | cut -d. -f 1 | cut -d/ -f 2)"
    pdftk "$i" background "split_intermediate/${fn}_bg.pdf" output \
                    "split_intermediate/${fn}_rs.pdf" &
done
wait
# Concatenate together result PDFs
pdftk $(echo split_intermediate/????_rs.pdf | sort) output merged2.pdf
This approach works well if e.g. merged.pdf is the input
and fglayer.pdf is a file consisting solely of info to be
stamped onto the data from merged.pdf.
See subdirectory example_background for a LaTeX file to
produce a fglayer.pdf file.
The core of the LaTeX implementation of this approach looks as follows:
\begin{document}
\let\cleardoublepage\relax
\newcommand{\macursec}[0]{}
\pagestyle{fancy}
\fancypagestyle{plain}{\pagestyle{fancy}}
\setlength{\fboxsep}{0pt}
\newcommand\mamark{\hspace{1cm}\fbox{\setlength{\fboxsep}{3pt}%
    \colorbox{white}{\begin{minipage}[T]{10mm}%
    \includegraphics[height=8mm]{masysmaicon}\end{minipage}%
    \begin{minipage}[T]{20cm}\flushleft
    {\macursec{}} | \textbf{\thepage}\end{minipage}}}}
\renewcommand{\headrulewidth}{0pt}
\lhead[]{}
\chead[]{}
\rhead[]{}
\lfoot[\mamark]{\mamark}
\cfoot[]{}
\rfoot[]{}
\newcommand\mapart[1]{\addcontentsline{toc}{section}{#1}%
    \renewcommand{\macursec}[0]{#1}\clearpage\setcounter{page}{1}}
%-------------------------------------------------------------------------------

\mapart{Section 1 slides}
\multido{}{44}{\vphantom{x}\clearpage}

\mapart{Section 2 slides}
\multido{}{44}{\vphantom{x}\clearpage}

%-------------------------------------------------------------------------------
\end{document}
Creating Large Graphics out of Small Ones
Re-assembling multiple small graphics into a large whole is only an
automatic operation in the simple cases like considered with the
previously described command:
pdfjam --nup NxM --scale SCALE. In cases a more
fine-grained control of the actual composition is needed, a manual
approach should be considered.
Multiple tools can be instantiated for the purpose
- Libreoffice Draw (SVG -> PDF)
- Although “office”-style products are sometimes frowned upon by the experts, LO Draw fully supports arranging images in a free-style fashion. As it can work with SVG files, vector graphics can be processed as inputs and as it can export to PDF, it can retain the vector quality for the actual output composition. LO Draw has been found to very rarely mess with the actual graphics’ contents and does not produce overly large PDF outputs. Working interactively with this tool can be slow, though, because rendering performance is a little on the slow side. In this case, it can help to disable the on-the-fly rendering of images: There used to be a checkbox buried in the menus somewhere to do this, but it could not be located in Libreoffice Draw 7.0.4.2 anymore? Finally, the implicit format conversion from SVG to PDF may be problematic for some graphics and use cases.
- Inkscape (SVG – SVG)
- Inkscape was already mentioned for conversion between formats. It can be used to compose graphics, too. When it works, it gives a greater flexibility and better placement precision compared to LO Draw: When graphics are reasonably coded, they can sometimes even be broken into components using the “ungroup” feature or by preparing the SVG code by hand. This can be used to e.g. remove components from otherwise hard-to-edit PDF graphics. The usual approach when using Inkscape is to import the graphics that are to be composed. While it is often possible to open a given SVG or PDF in Inkscape, it is sometimes hard to copy graphics from one window to the other without heavily distorting the contents. It can help to pre-convert the graphics of interest to SVG or even do some identity transformations before opening the respective graphic in order to have it in a more copy-friendly state. Overall, for complex compositions of graphics from multiple sources, Inkscape is not my first choice.
- LaTeX/TikZ (PDF – PDF)
-
If the workflow is more pdf-centric and a conversion to SVG should be
avoided or if other factors favor the use of a TeX backend, LaTeX can be
a viable choice. Using TikZ it becomes possible to place nodes that may
themselves contain entire graphics e.g. by using
\\includegraphicsinside as a node’s content. - HTML (SVG – PDF)
-
Under special circumstances it might become sensible to encode the
composition of graphics in HTML and export that back into a graphics
format like PDF. Although frowned-upon by HTML designers, HTML
<table>elements provide for a flexible means of organizing graphics that can be hard to achieve in any of the other programs. HTML cannot include PDF directly, hence inputs should come as SVG files. On the output side, browser print functions andwkhtmltopdfproduce a PDF. This means a conversion similar to the LO Draw case is included.
Annotate with Defined Coordinates
Sometimes there is an existing graphic which should be drawn into at defined coordinates. Here, defined coordinates refers to the fact that the graphics’ scale is not only qualitative but that the position of points and lines actually represents a value.
In a paper-based workflow it is possible to draw to scale using geometry triangles and other drawing auxiliary tools. In all-digital scenarios where the vector properties should be retained (rather than printing something out and scanning it back in), it is a little more complicated.
There are multiple basic techniques that can be used in such cases:
With Arbitrary Scales
In case the original graphic already indicates some scale in form of numbers in a grid, count the number of divisions. Then create the vector graphic that is going to be adjusted to the scale with the same number of divisions and scale it to fit the predefined grid.
The same technique can be used when there is a sort of axis labelling by marking one point on each of the axes at a defined number and then marking the same point in the new graphic to be created (e.g. the one representing the data to be drawn into the graph). Afterwards, the new graphic can be scaled to fit the defined limits by making the common points identical between the two graphics.
Useful tools in this regard are the following:
- Inkscape – used for scaling and copying tasks
- Geogebra – used for plotting graphs. By putting a (potentially bitmap) copy of the target background into Geogebra’s coordinate system, one can obtain common points for the purpose
- Libreoffice Calc – LO charts can be adjusted in various ways including the possibility to fine-tune the number of units for grids. This can enable the transformation into a common scale, too.
With Defined Scales
In case the original graphic indicates a common scale like e.g. 1:50 or such, it is possible to create the new graphic of interest in the same scale and then copy them over each other. This will avoid re-scaling but some common programs do not support output at defined lengths.
Useful tools for this are the following:
- SVG – SVG graphics can be specified with actual sizes in millimeters. With careful GUI use, Inkscape can do this to some extent, too.
- LaTeX+TikZ – can create graphics to scale, too.

Add Table of Contents
To achieve a similar effect to the approach described under
Example Script for Background Stamping before, one can also use
LaTeX’ includepdf feature and in the process optionally
generate a Table of Contents, too.
In example_inclduestamp_toc/includestamp.tex an example
LaTeX code is provided for the purpose. In the example,
empty100.pdf serves as a substitute for any real PDF
document that one would like to annotate using this approach.
At the core, the code looks as follows:
\begin{document}
\let\cleardoublepage\relax
\newcommand{\macursec}[0]{}
\pagestyle{fancy}
\fancypagestyle{plain}{\pagestyle{fancy}}
\setlength{\fboxsep}{0pt}
\newcommand\mamark{
    \begin{tabular}{|p{7cm}p{6.5cm}p{3cm}|}
    \hline
    \cellcolor{white} Some Topic&
        \cellcolor{white} \cmd{info@masysma.net}, 13.08.2021&
        \cellcolor{white} Page \thepage/\pageref{LastPage}\\
    \cellcolor{white} More Info&
        \multicolumn{2}{l|}{\cellcolor{white}\textbf{\macursec}}\\
    \hline
    \end{tabular}
}
\renewcommand{\headrulewidth}{0pt}
\lhead[\mamark]{\mamark}
\chead[]{}
\rhead[]{}
\lfoot[]{}
\cfoot[]{}
\rfoot[]{}
\newcommand\mapart[1]{\addcontentsline{toc}{section}{#1}%
                \renewcommand{\macursec}[0]{#1}\clearpage}

\tableofcontents % optional

\mapart{Long Part Description 1}
\includepdf[pagecommand={},pages=1-30]{empty100}

\mapart{Long Part Description 2}
\includepdf[pagecommand={},pages=31-37]{empty100}

\end{document}
Drawing on the Page Background with TikZ
Above approach can be combined with TikZ to draw directly on the page or its background. The following code contains some handy excerpts illustrating the approach. There is currently no compilable example in the repository about this technique, though.
\usetikzlibrary{backgrounds}
% ...
\begin{document}
% ...

\pagestyle{fancy}
\fancypagestyle{plain}{\pagestyle{fancy}}
\newcommand\maextracmds{}
\newcommand\matikzinfobox{
    \node[anchor=north west,xshift=0.5cm,yshift=-0.75cm] at
        (current page.north west) {%
            \begin{tabular}{|l|l|}
            \hline
            \footnotesize AAAAA & \footnotesize \pagemark \\
            \hline
            \multicolumn{2}{|c|}{\scriptsize BBBBB}\\
            \hline
            \end{tabular}
        };
    \maextracmds
}
\newcommand\mamark{\begin{tikzpicture}[remember picture,overlay]
    \matikzinfobox
\end{tikzpicture}}
\renewcommand{\headrulewidth}{0pt}
\lhead[\mamark]{\mamark}
\chead[]{}
\rhead[]{}
\lfoot[]{}
\cfoot[]{}
\rfoot[]{}

% ...
\includepdfmerge[pagecommand={\pagestyle{fancy}}]{...pdf file here...}

% ...

\begin{tikzpicture}[remember picture,overlay]
    \begin{scope}[on background layer]
        \node[xshift=5mm,anchor=west] at (current page.west) {\dots};
    \end{scope}
    \matikzinfobox
\end{tikzpicture}
To create new Graphics
There are countless applications to create vector graphics. Almost any program that has a print function can be used for the purpose. The following shows some selected tools that have been found to be useful for creating new vector graphics.
- Xournal (package
xournal) - This program can be used for PDF annotation but can also create standalone/empty documents. It is best for annotation purposes and cases where the actual coordinates and scales of drawing do not matter.
- (L)O Suite (package
libreoffice) - Office suites provide multiple formats of documents that can all be exported to vector graphics. This is not strictly limited to Libreoffice Draw, Calc and Writer but also applies to the MS Office variants. Many people seem to be able to create incredibly complex graphics all in Powerpoint so that may contain some secret simplicity for entering graphics. I personally do not find any of the office suites to be overly intuitive to use correctly.
- Dia (package
dia) - This diagram editor can be used to quickly create flowcharts and other boxes-and-lines-based charts. It also supports a variety of special templates from which specialized diagrams can be created e.g. Entity-Relationship diagrams. While Dia supports UML, entering UML is rather clumsy and has some annoying caveats. It is e.g. impossible to resize a class diagram to an arbitrary size of choice which effectively makes it impossible to achieve an UML layout where parts are all grid-aligned and connected by mostly straight lines in 90° angles. Dia’s PDF export creates multiple pages by default and the diagram components are very large by default making small diagrams already span multiple pages. The SVG export works fine, though.
- UMLet
-
This is (by the name) an UML tool but given that it can draw generic
rectangles and generic arrows combined with colors and transparency can
be used for a lot of charting tasks. It needs some guessing and
searching to find out about the syntax of formatting – some of it is
markdown-inspired, e.g.
*bold*, some other things are UMLet’s own way of doing things. Having overcome this hurdles, it is much more efficient to create an UML diagram in UMLet rather than Dia. The default UMLet line thickness and font are sometimes ill-suited for printing them directly. If UMLet is to be used in a print-centric workflow, consider printing out some sample diagrams first and find out what to change for acceptable printing quality – it may mostly be a matter of font choice and line thickness. UMLet is particularly well-suited in case an efficient combination of text and GUI-based approaches for diagram creation is sought and where the diagrams of interest are UML or generic boxes and lines. Anything that becomes complex (think of gradients, shadows, weird effects) is better done in other applications. - Inkscape (package
inkscape) - This SVG editor provides a lot of flexibility in creating arbitrary vector-based shapes with colors. It excels at tasks where there is a clear mapping to SVG primitives. Inkscape’s font handling and object moving and resizing features are less convoluted than other programs’.
- draw.io
- Although the name suggests differently, this is neither a drawing-centric nor a webapp-only program. It is a fully-featured diagram drawing tool that conceptually combines Inkscape and Dia elements together with a more intuitive GUI interface. Note that I do not have any first-hand experience with this tool yet, but I consider adding it to my toolbox.
- HTML + CSS
-
Although it seems a little counter-intuitive, HTML + CSS can be quite
viable a choice for creating printed forms. This is due to the
fact that styling and sizing empty HTML tables and
<legend>elements overall is pretty straight-forward especially if some HTML and CSS2 are already known. It even works to (a relative) scale! After that one can just use the browser’s print function to obtain a perfectly styled form. Of course, this is less well-suited for general purpose graphics but similar to LibreOffice Writer or LaTeX can be quite viable for document-like graphics purposes. - LaTeX+TikZ
- Although a command-line program with text input may not be the most intuitive choice for creating graphics, LaTeX and TikZ provide a powerful toolbox for creating highly complex graphics with perfect typesetting. TikZ is a powerful diagram framework that exceeds the capabilities of Dia and Inkscape taken together. Its syntax is arcane though. The documentation with over 1300 pages is rather comprehensive and shows a lot of helpful examples (cf. https://tikz.dev/ and https://ctan.org/pkg/pgf?lang=en). Unlike other markup languages, TikZ provides primtives (like e.g. draw lines between points and such) and advanced concepts (like e.g. named nodes whose distances may be specified relative to each other up to entire tree structures generated from just specifying the nodes and their nesting. This allows for solving a variety of graphics tasks if you know how to go about them. The learning curve is steep and there does not seem to be a defined way to learn it beyond some beginners understanding. Maybe it would help to trying to use TikZ for all one’s graphics needs for a defined long period of time, but whenever there is no Stackoverflow entry nor an exactly matching example in the documentation, one can get lost in TikZ world…
Examples for HTML and CSS based Forms
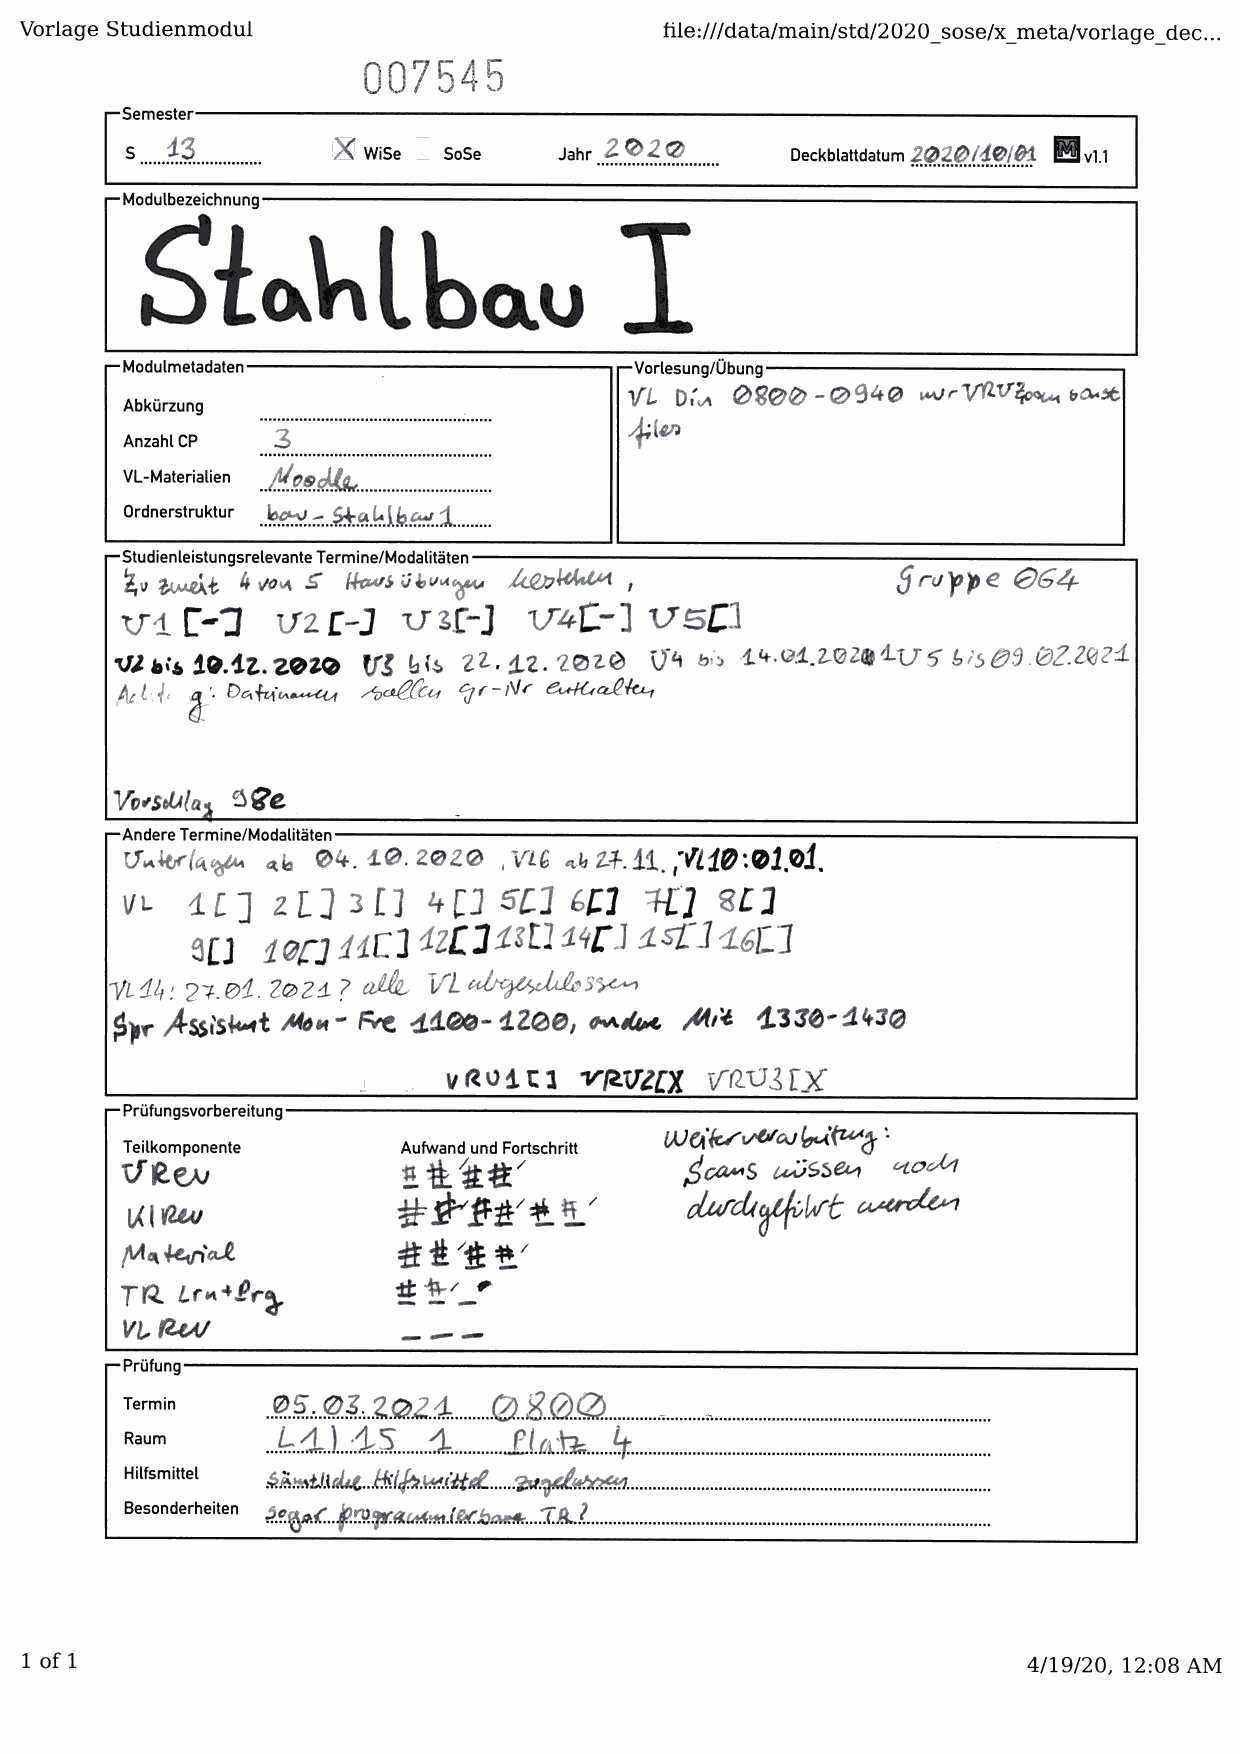
This section demonstrates the use of HTML and CSS to design useful vector graphics forms. The following forms are mostly in German but the point is less the content (it may even be incorrect) but more the form design that can be created with a few HTML and CSS instructions.
The final graphics was obtained by using Firefox’ print function to create the PDF.
File example_vdstdmod.xhtml contains a form for
organizing a study module. Below pictures show a blank and a filled-out
version:

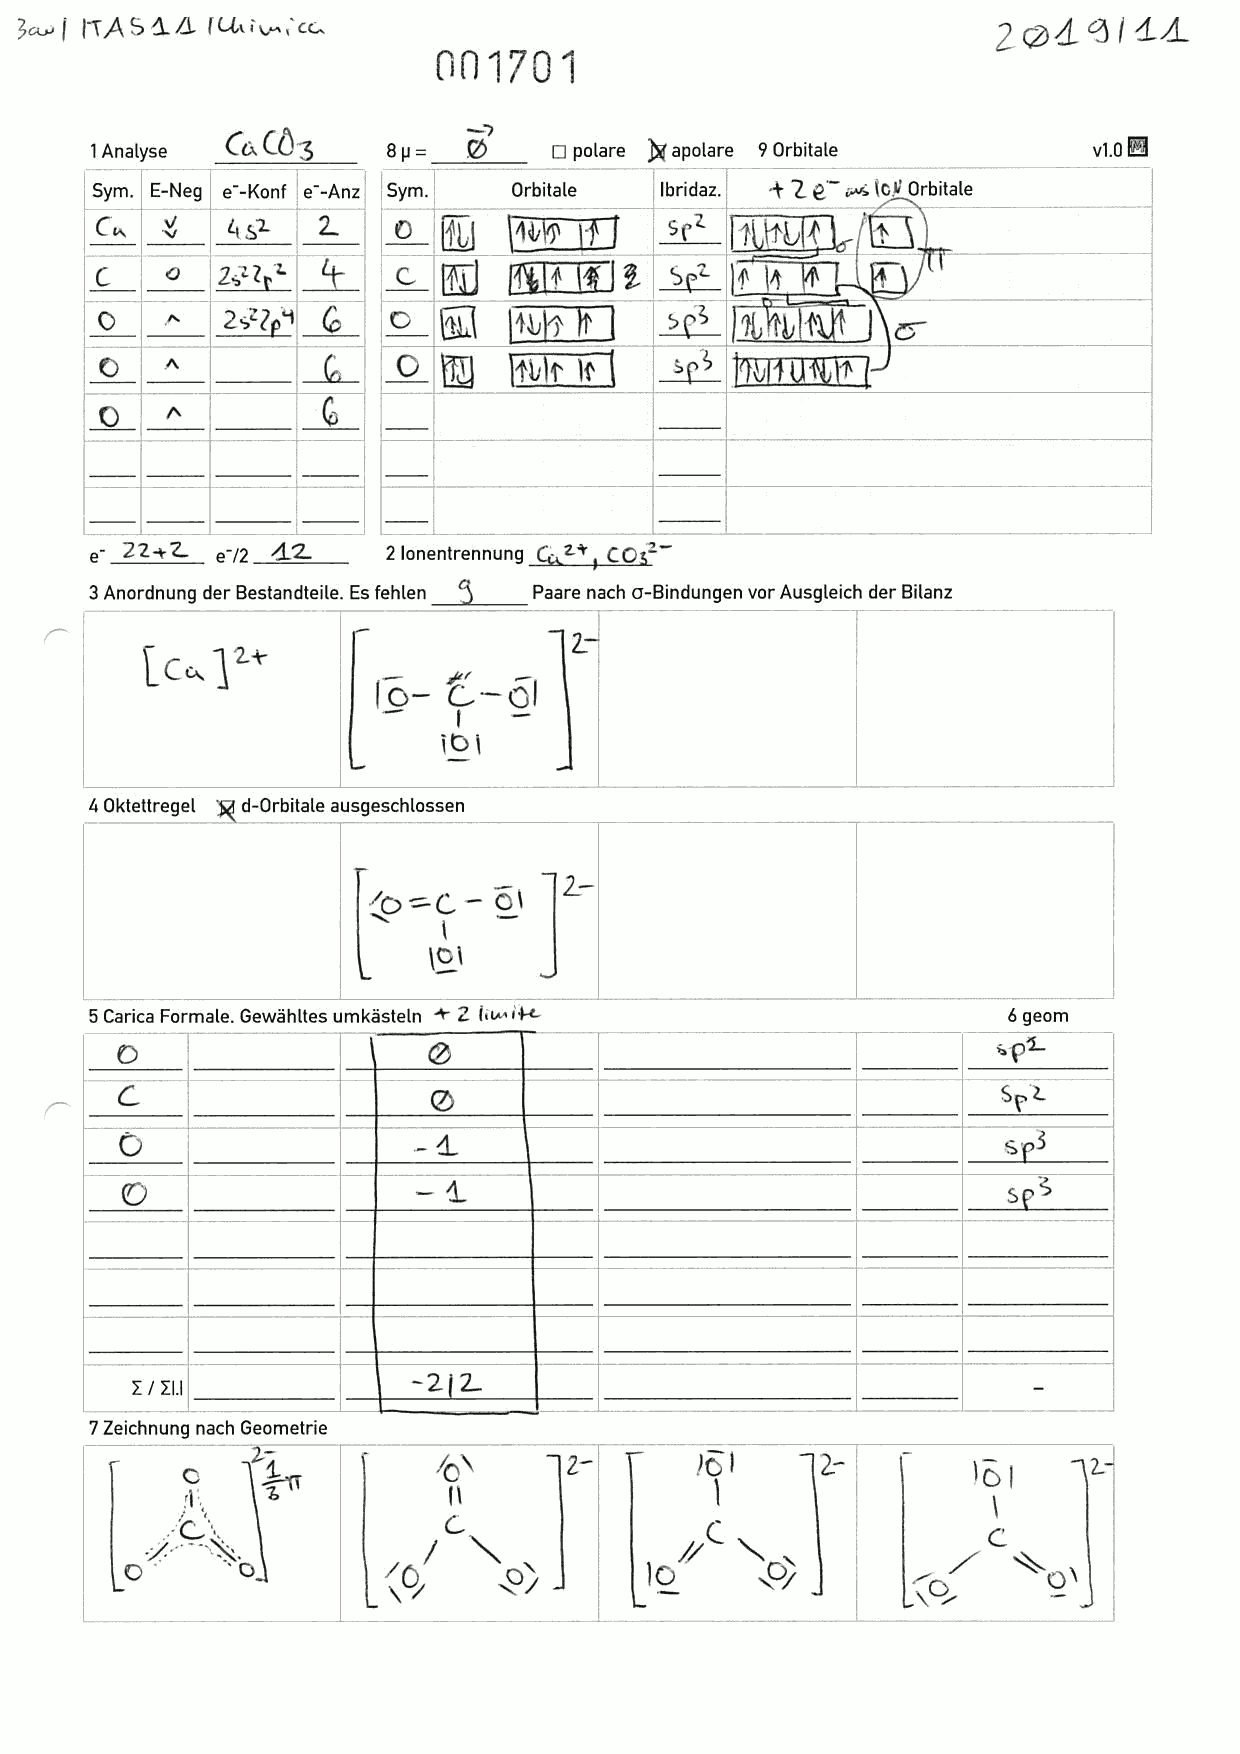
File example_molekuelformular.xhtml contains a form that
was used to train for a chemistry exam in Italy. Again, there is the
blank version and a filled-out version. Note that the blank version is
v1.1 (a later revision) whereas the filled-out version corresponds to an
older design.

ASCII Art
The next section explains rendering text-based graphics. There are some tools that simplify the creation of such graphics and enhance their versatility. These solutions to vector graphics are definitely a niche. However, restricting graphics to ASCII art limits complexity in an interesting sense that can result in increased quality whenever this forces designers to remove much of the extra bells and eye-candy and instead strongly focus on the actual content and wisely use the limited number of design elements provided by the ASCII or Unicode charsets.
- Ditaa and Ditaa2EPS
- The underdog among all of the tools presented here: Ditaa is a program that takes ASCII-art graphics and creates bitmaps out of them. The separately downloadable Ditaa2EPS does the same but produces an EPS (i.e. vector) output. Ditaa uses some heuristics (and a specific syntax) to determine the actual output formatting which is intended to allow fine-tuning the output graphic while retaining ASCII readability. The output quality after sending an arbitrary ASCII art graphics to Ditaa can be hit-or-miss but if graphics are designed with Ditaa in mind upfront, it becomes possible to create graphics that are portable from text consoles to presentations or styled text documents and websites.
- DrawIt! (
drawit.vim) - This VIM plugin (https://www.vim.org/scripts/script.php?script_id=40) provides an interesting means to draw ASCII art in the VIM text editor. It is useful in combination with template files for filling specific page layouts as to limit the drawing space to extents that can be reasonably printed on paper. The input method takes some getting used to but is much faster than assembling the ASCII art in a regular text editor especially if large boxes are to be drawn. See templates(32) for a package that contains empty ASCII art pages for A3 and A4 print sizes. See the online vimhelp for usage instructions: http://www.drchip.org/astronaut/vim/doc/DrawIt.txt.html. Download the plugin from the author’s home page here: http://www.drchip.org/astronaut/vim/vbafiles/DrawIt.vba.gz.
To convert Console Text to Graphics
Sometimes, it can be beneficial to convert text into graphics. This is especially useful to preserve colors and formatting. Most GUI applications support “print” operations which can produce a PDF or similar. For console-based applications, such options are not always available.
Using the “print” function of Console Applications
In vim, you can print the document using
:ha > print.ps which produces a postscript document.
Additionally, :TOhtml can be used to generate an HTML
representation of the currently opened file including syntax
highlighting. For many printing purposes it may make sense to invert the
color scheme by setting :set bg=light first.
From Terminal To Text
If anything is displayed in the terminal, it can most often be selected by the mouse and copied. Alternatively, it is often possible to redirect programs’ output into text files.
Whenever control sequences are contained, this can become difficult. There are then two major options that can be considered:
- Tools from package
colorized-logscan be used to strip ANSI Escape Sequences or convert colorized terminal output to colorized HTML which may enable further processing. - Terminal multiplexers like
tmuxandscreenallow selecting a portion of the window contents and pasting them again. To copy the output of a currently running program intmux, follow these steps:- Make sure the output you want to copy is displayed in tmux and the tmux window size matches what you want to be the output width of the text.
- Press [CTRL]-[B] then [[] (opening bracket) then jump to the beginning of the area of interest with [H] [J] [K] [L]
- Press [V] to enter visual mode.
- Select lines with [J]
- Press enter once everything of interest is selected.
- Enter a command like
cat > /tmp/file.txt - Press [CTRL]-[B] then []] (closing bracket) to paste the contents
- Press [CTRL]-[D] to close input to
/tmp/file.txt - The plain-text copy of the output should now be in
/tmp/file.txt.
Printing ASCII Art
Graphics can not only be created in popular graphics formats such as SVG, PDF or PNG but also in form of plain text files as “ASCII art” i.e. graphics made of ASCII (or nowadays Unicode) characters. Such graphics are useful in that they can be processed on text-based terminals and embedded into text files of any kind e.g. within program source codes. Although they are not vector graphics in the usual sense, they can still be scaled to almost arbitrary sizes by choosing a larger font size.
Problems with ASCII art occur whenever the output of interest is intended to be colored. There are ANSI Escape Sequences which can be used to colorize the output on a Terminal. There do not seem to be any good ANSI Escape Sequence-capable ASCII art editors, though.
This repository provides a small set of scripts to aid in the process of creating colorized ASCII art. The workflow is as follows:
- Create monochrome ASCII art in a text file (let’s call it
DATA.txt) - Copy
DATA.txttoSTYLE.txtthen make it a stylesheet - Render the colorized version using scripts
ascii2console.awkorascii2pdf.sh.
The idea behind a stylesheet here is that it has the same form as the actual graphics but characters are not displayed but rather describe the color of the text to display.
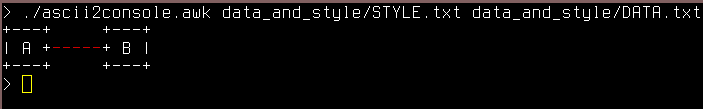
Here is a simple example.
DATA.txt
+---+     +---+
| A +-----+ B |
+---+     +---+
STYLE.txt
+---+     +---+
|   +rrrrr+   |
+---+     +---+
Here, the r characters in the stylesheet advise the
scripts to color that part of the original graphics in red. I.e. the
output could look as follows:
The following letters are supported to indicate colors:
| Letters | Colors | ANSI | HTML |
|---|---|---|---|
| g, G | green | 1/32m | 00aa00/00cc00 |
| w, k | white | 1;37m/1;30m | 777777/ignored |
| y, Y | yellow | 1/33m | 999900/cccc00 |
| p, P | pink, magenta | 1/35m | 990099/ff00ff |
| r, R | red | 1/31m | 900000/ff0000 |
| b, B | blue | 1/34m | 000090/0000ff |
| c, C | cyan | 1/36m | 008080/00aaaa |
In addition to its support for stylesheets, script
ascii2pdf.sh also supports specifying the output page size
and selects a sane font by default (if installed).
As an additional feature, ascii2pdf.sh supports
specifying custom color letters and overriding the defaults by
processing any lines at the end of the stylesheet as CSS code to add to
an intermediate XHTML output page.
To render to Bitmap
Sometimes a vector graphic is available but a bitmap (i.e. pixels) are needed. Depending on the source format, there are multiple ways to render vector graphics.
ImageMagick
The convert program provided by ImageMagick is easy to
use on the command line:
convert -density 300 INPUT.pdf OUTPUT.png
convert -density 300 INPUT.svg OUTPUT.png
Parameter -density specifies the target resolution in
DPI. The given example (300) may be well suited for a medium to
high-quality output. Reduce this parameter to reduce output file size at
the expense of quality.
Due to security concerns, it may be necessary to enable this feature first, cf: https://askubuntu.com/questions/1081895/trouble-with-batch-conversion-of-png-to-pdf-using-convert
RSVG (convert from SVG)
The rsvg-convert utility can be used for SVG to PDF
conversion but also as a means to render SVG to bitmap:
rsvg-convert --dpi-x 300 --dpi-y 300 -f png INPUT.svg -o OUTPUT.pngSimilar to the ImageMagick varaint, the intended output
resolution can be specified. Check the output of
rsvg-convert --help for a listing of other means to specify
the output sizes.
wkhtmltoimage (convert from HTML)
wkhtmltoimage -f png INPUT.html OUTPUT.pngSimilar to wkhtmltopdf, this tool can be used to convert
HTML pages to bitmap exports. Like the Firefox screenshot function, this
allows the conversion of pages which do not fit the screen and hence
cannot be captured in their entirety by means of a generic screenshot
function.
GUI Applications
In addition to above mentioned command-line programs, these are some noteworthy GUI programs with bitmap export capabilities:
- Inkscape
- GIMP
- Firefox – This browser is worth noting because it provides a screenshot function that can take screenshots larger than the viewport/screen size and hence be used for many SVG and HTML to bitmap export tasks.
License
The content of this document and relevant scripts are available under GPLv3 or later. Feel free to contact me if you would like to use them under a different license.
Vector Workflow - Avoiding unnecessary Bitmaps in Graphics Handling,
Copyright (c) 2022--2024 Ma_Sys.ma <info@masysma.net>.

This program is free software: you can redistribute it and/or modify
it under the terms of the GNU General Public License as published by
the Free Software Foundation, either version 3 of the License, or
(at your option) any later version.

This program is distributed in the hope that it will be useful,
but WITHOUT ANY WARRANTY; without even the implied warranty of
MERCHANTABILITY or FITNESS FOR A PARTICULAR PURPOSE.  See the
GNU General Public License for more details.

You should have received a copy of the GNU General Public License
along with this program.  If not, see <http://www.gnu.org/licenses/>.
Conclusion
If anything, remember the following tools from this article:
gpdfx– PDF extraction tool.rsvg-convert– tool to convert SVG to PDF.pdf2svg– tool to convert from PDF to SVG.
From the convoluted complexity of all of the vector graphics operations it is pretty obvious why there are still so many blurred screenshots in place of actual vector graphics!
Future Directions
There are some additional tricks worth explaining. Most notably, my peculiar LaTeX+Maxima integration is probably worth explaining in a dedicated article.
See Also
- programming_fonts(37) provides some information about useful Programming Fonts that may as well be used for rendering ASCII art.
- conf-cli(32) provides script
svg2pdfas an alias forrsvg-convert. - templates(32) provides ASCII art frame templates if to use for cases where it is intended to print the resulting drawing to a defined paper size like A3 or A4.
- Build instructions for an
mdvl-umletpackage: https://github.com/m7a/lp-umlet - Packaging instructions for an
mdvl-pdfscissorspackage: https://github.com/m7a/bp-pdfscissors