Background
Previously, an advanced monitoring scheme using Grafana, Influxdb and Telegraf was used at the Ma_Sys.ma: dashboards_with_docker(37). As of 04/2021, this ceased to work due to errors in the Influxdb database: It would fail to start and reject all attempts to send data with 401 Unauthorized errors.
The issue might have been caused by submitting a lot of metrics while creating the backup tool comparison backup_tests_borg_bupstash_kopia(37), but the actual reasons can only be speculated about.
The advanced monitoring scheme had been under testing for some time, but was still lacking some checks like MDADM array health. Given the failure of the Influxdb, three ideas came to mind:
- Try to reset the Influxdb and re-start the advanced monitoring using an empty database. It seemed that chosing this option would sooner or later cause problems again given that the cause for the database failure had not been identified.
- Switch from Influxdb+Telegraf to Prometheus+Node Exporter. This is a very viable choice but was not pursued due to the high amount of work needed to reconfigure all machines (TLS woes again!) and the re-create all Dashboards for the different data supplied by Node Exporter. It still seems like a good exercise to do this some day, but for now it seemed too much.
- Use less complicated (smaller, fewer) software. There are many tools dedicated to monitoring and they often solve a lot of the problems associated with the “selfmade” solutions out of the box. Especially, following this way, it seemed possible to fix some of the old issues regarding the existent monitoring that turned out to be difficult in the past.
Hence, the search for an alternative monitoring program began.
A Variety of less complicated Monitoring Programs for Linux
This section collects all the canditates considered for monitoring that were not used for the purpose in the end. It serves as a reference should there be need to reconstruct the monitoring again :)
Atop
Links: https://atoptool.nl/, Debian package atop
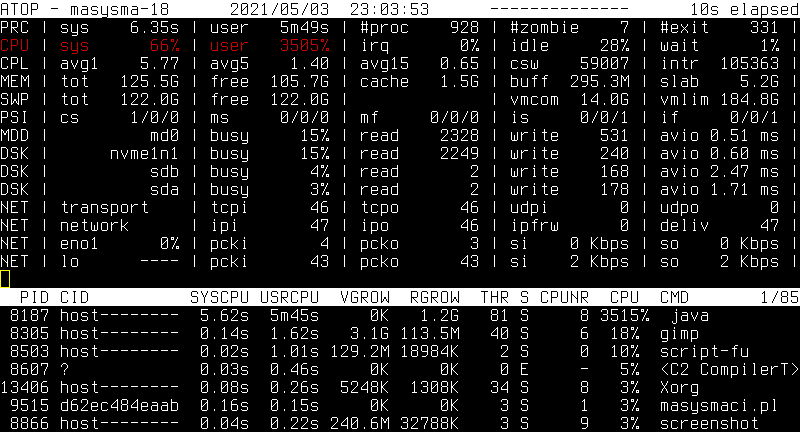
Atop is one of my favourite live monitoring tools for console usage on Linux. Atop displays the activity on a system in a seemingly intimidating text-based fashion squeezing as much information on the screen as possible.
Here are the reaons for this being my favorite:
- The first nice thing about it: Any metric that is the current “bottleneck” is displayed in cyan (medium load) or red (high load). Unlike other tools, whose graphs one needs to study to digest to what the actual issue is, atop marks it right away.
- Atop comes with
atopsar: Runningatopas a daemon generates compact binary reports that can be viewed withatopsarto check past states of the system.
Atop collects most important performance metrics and provides a means to view their history. There are still some reasons for why Atop is not the (only) monitoring tool of choice for unattended systems:
- Atop does not have a web interface. This needs more setup on the viewing side. I was tempted to create some sort of periodically extracted report that would just convert the ANSI escape sequences to HTML, but I did not do it this time :)
- Processing Atop’s historic data is difficult: One can interactively
do it with
atopsar, but it is not straight-forward to extract periodic reports. For viewing larger time frames, diagrams would be helpful.
Here are some references about how one might boost Atop for monitoring purposes:
- https://github.com/fnep/aplot
- https://github.com/rchakode/atop-graphite-grafana-monitoring
- https://pcp.readthedocs.io/en/latest/UAG/IntroductionToPcp.html: PCP seems to include an atop variant that makes data accessible more easily. But: PCP itself seems to be as complicated as it gets…
To conclude: Although I know this tool, although I like it very much, I did not set it up for monitoring this time as it has some rough edges for that use case.
Glances
Links: https://github.com/nicolargo/glances/, Debian package glances
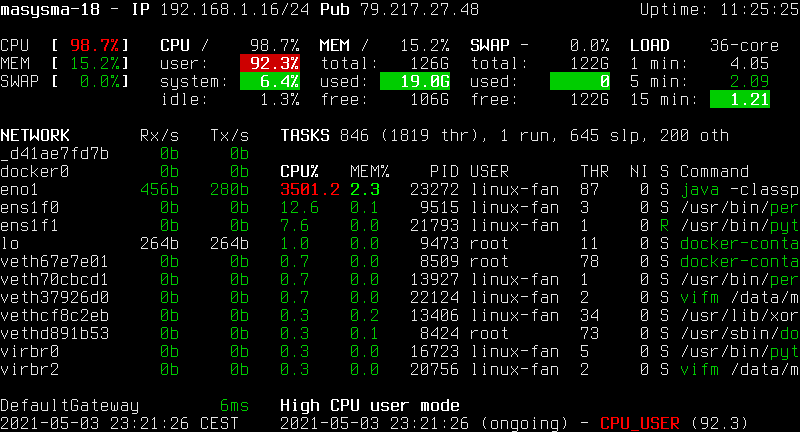
Glances serves a similar purpose to Atop but is aimed at larger screen spaces. It does not monitor I/O as good as atop, but adds information on sensor readings and filesystem usages if enough screen space is available. Glances does not (by itself) offer a means to store and retrieve historic data.
In addition to its console-based live monitoring, Glances can send metrics to time-series databases, produce alerts and display its output on a web interface. This makes it a candidate for use in unattended monitoring scenarios, but the necessity of a time-series database for historic data would again complicate things too much.
Netdata
Links: https://github.com/netdata/netdata, Debian package netdata
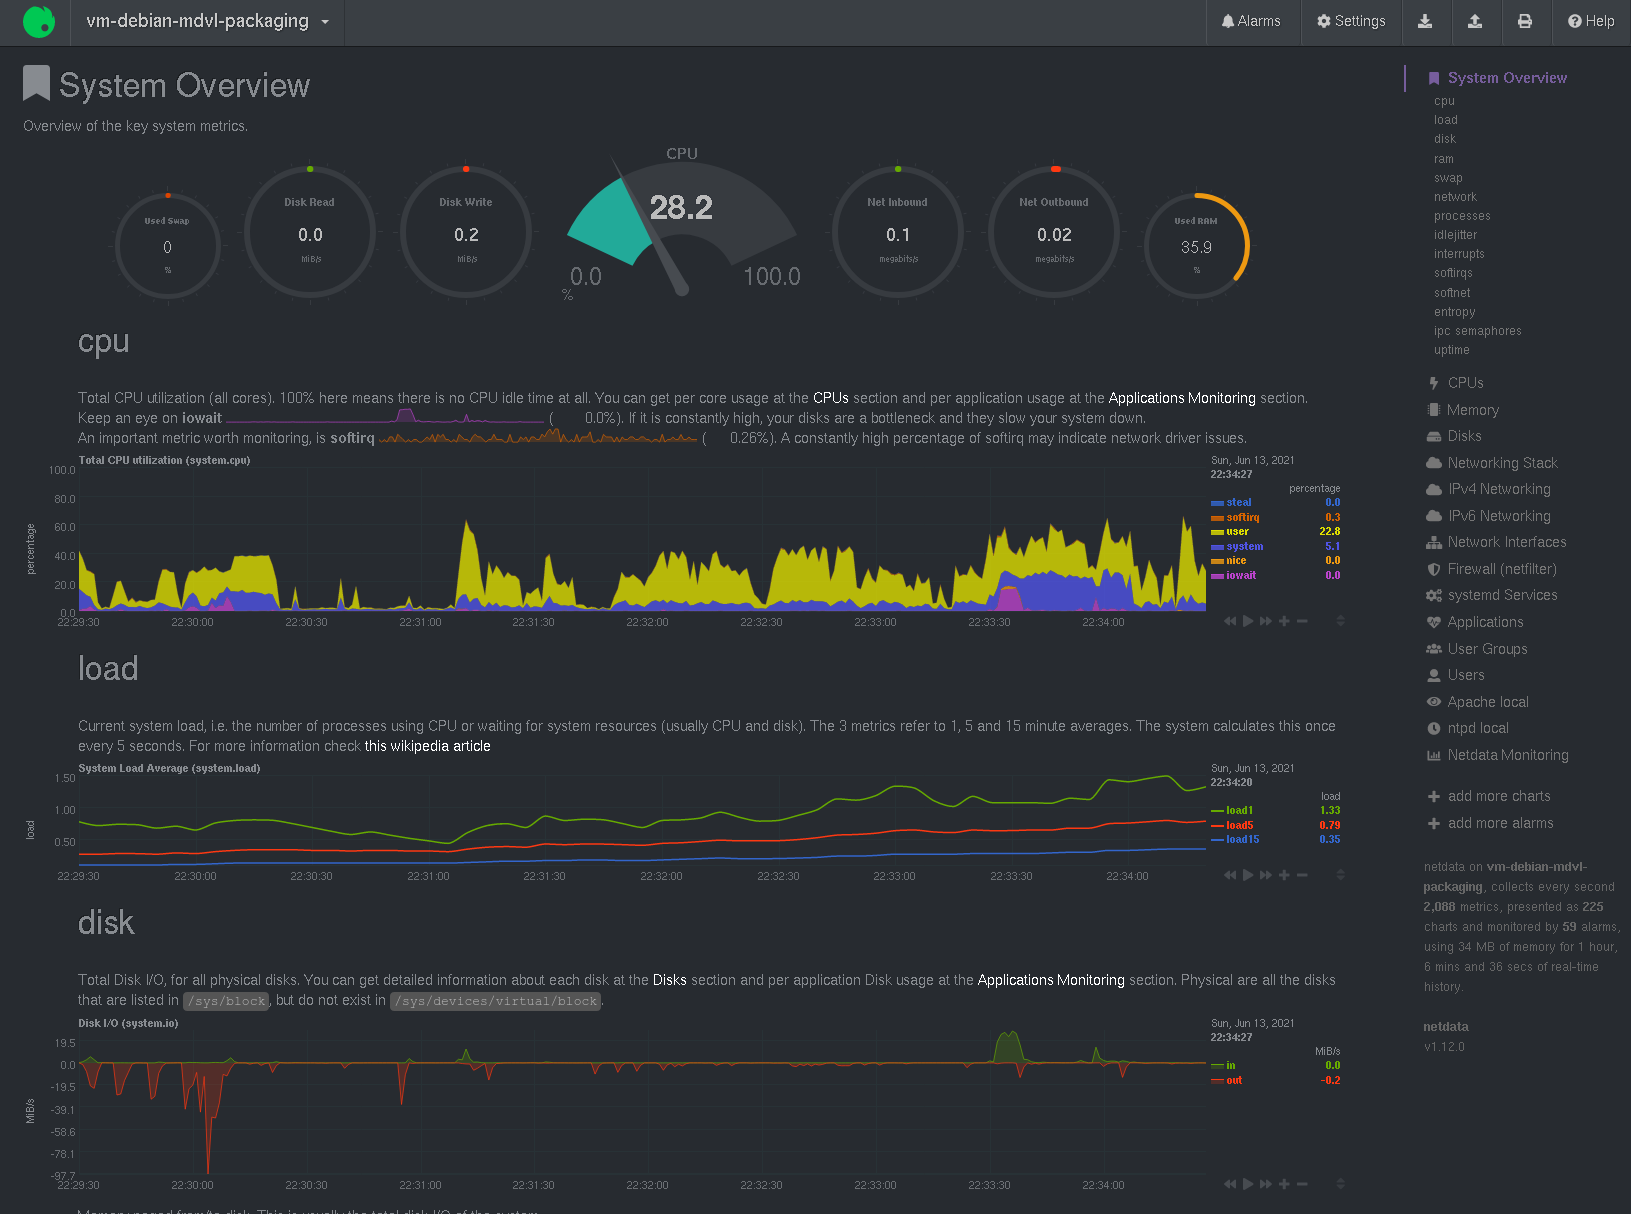
Netdata graphs a huge number of metrics in a web interface (under port 19999). Similar to glances, Netdata can send metrics to an external server. Similar to Grafana, it allows displaying the metrics as graphs over time or gauges for showing the current value.
Some notes about Netdata’s features with links to the respective documentation:
- The diagrams to show can be configured.
- By default, metrics are persisted for two days, but the duration is configurable, see https://learn.netdata.cloud/docs/store/change-metrics-storage
- An external backend database can be used to store metrics, see https://learn.netdata.cloud/docs/agent/exporting
- Netdata can monitor S.M.A.R.T data, see https://learn.netdata.cloud/docs/agent/collectors/python.d.plugin/smartd_log
- It it can generate alerts, see https://learn.netdata.cloud/docs/agent/health/notifications
- By default, Netdata does not monitor disk usage, but it can be configured, see https://learn.netdata.cloud/docs/agent/collectors/diskspace.plugin
- Netdata can monitor MDADM RAIDs, see (already merged!) https://github.com/netdata/netdata/pull/1489
- Netdata can monitor ZFS pool status, see (new and already merged!) https://github.com/netdata/netdata/pull/11071
To summarize: Although it seems a little odd to present all of the system’s health status as time-value-plots, Netdata can monitor just about everything. It is a viable alternative to the Monit+Monitorix combination explained further below.
phpSysInfo
Links: https://github.com/phpsysinfo/phpsysinfo, Debian package phpsysinfo
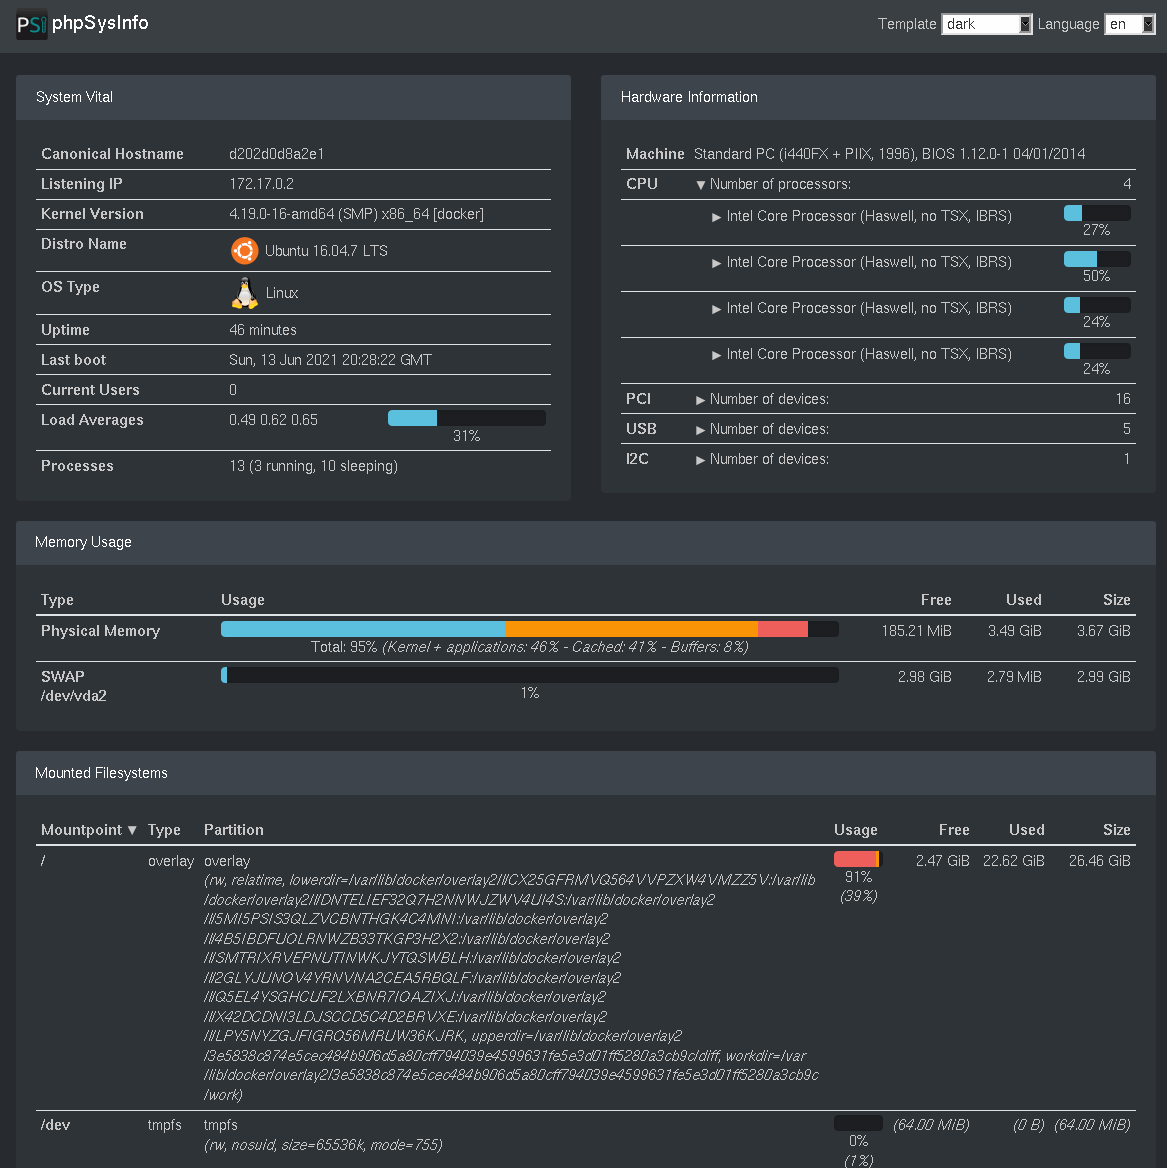
phpSysInfo displays the system status in a tabular fashion. It focuses on the machine’s properties combined with memory and file system usage. While it gathers some information on load, phpSysInfo does not provide any diagrams with historical data. Instead, it focuses on displaying the current system health state.
phpSysInfo could be used as an alternative to Monit for the Ma_Sys.ma monitoring purposes. Given that it runs entirely in PHP, configuring phpSysInfo to have access to the system metrics as well as running securely on the web server seems to be a little more complicated than with the other tools.
Other Options
The following is a list of tools that were considered, but not tested extensively for one reason or another:
- Cacti: see notes at the very end if you are interested in this, https://www.cacti.net/index.php, in Debian
- Cockpit: https://cockpit-project.org/, in Debian
- collectd: https://collectd.org/index.shtml, in Debian
- MRTG: https://oss.oetiker.ch/mrtg/doc/mrtg.en.html, in Debian
- nikkiii: https://github.com/nikkiii/status
- Statping: https://github.com/statping/statping
- Ward: https://github.com/B-Software/Ward
Combining Monit and Monitorix for a comprehensive and simple System Monitoring
As no single tool seemed to fit all the needs, two good ones were combined:
- Monit performs OK/FAILED status checks and presents them under http://127.0.0.1:2812.
- Monitorix creates performance graphs and presents them under http://127.0.0.1:2813/monitorix
Monit
Links: https://mmonit.com/monit/, Debian package monit
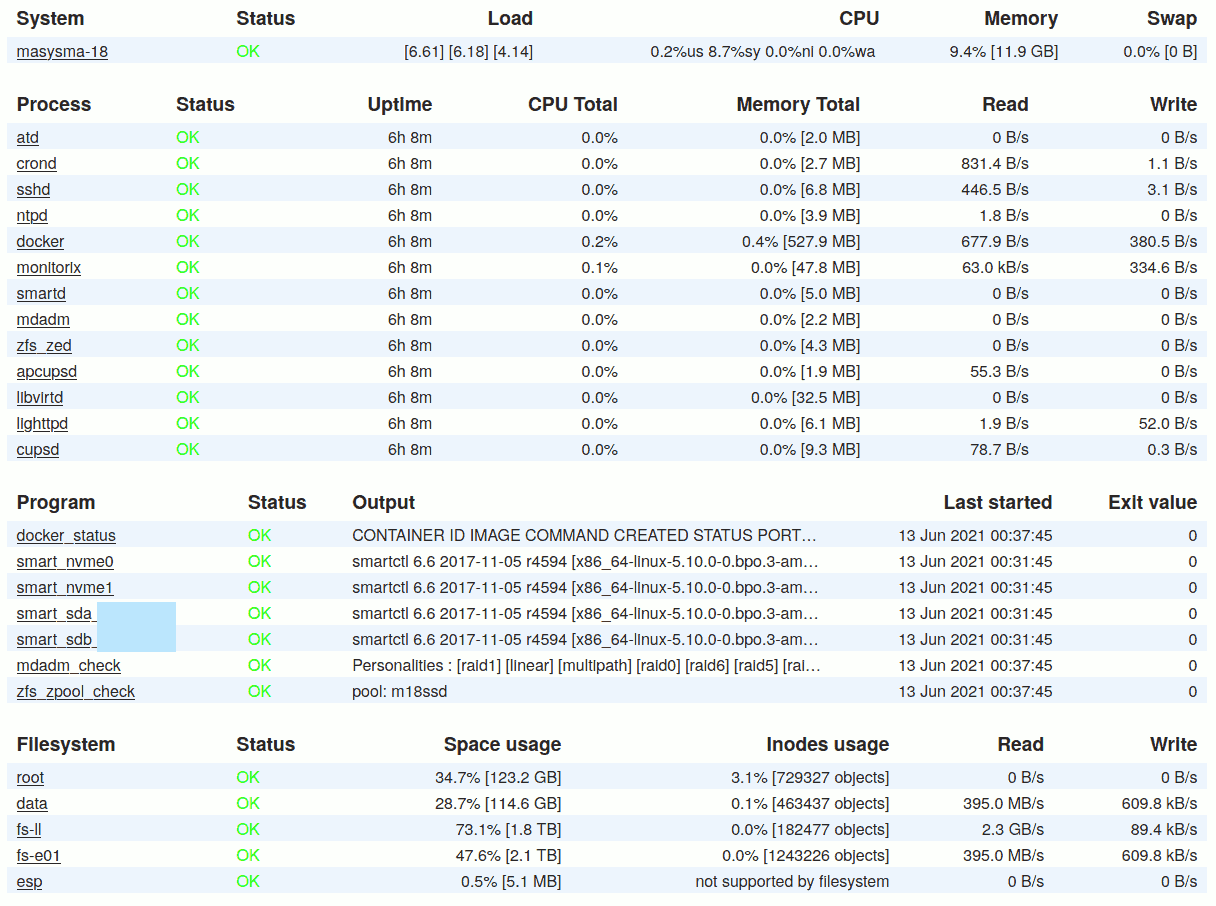
Monit creates a status page that quickly allows one to identify if anything is wrong with the running system. If the system is working normally, all items display a green “OK”.
It does not log historic information and does not visualize them graphically. Monit does, however, allow for presenting the currrent status of textual information which is used by a series of custom scripts descripted in the following.
The complete configuration and scripts can be found in the
repository. See file masysma-default.
System Resources
Monit checks that system resources are not constantly overloaded. This is especially important for disk space, but also for CPU load on small systems whose cooling might not be up to constant 100% CPU loads.
Services
Monit ensures that important services are running. The choice of services was hand-crafted to make sure only the maningful ones are included. It mostly only checks that the services are running and that some of their important files exist with correct permissions. The associated monitoring instructions have been derived from the examples supplied by Debian.
RAID
Monit runs a custom script to check the RAID status. It is “dead simple” and needs only two lines of code:
#!/bin/sh -eu
# see statusscripts/mdadm.sh
cat /proc/mdstat
! grep -qF _ /proc/mdstat
Here, cat ensures the web interface will show the whole
/proc/mdstat and grep -qF _ finds any failed
drives listed in /proc/mdstat.
ZFS
Similar to RAID, ZFS’ status is also monitored by a custom script:
#!/bin/sh -eu
# see statusscripts/zpool.sh
zpoolstatus="$(LANG=en_US.UTF-8 zpool status)"
printf '%s\n' "$zpoolstatus"
printf '%s\n' "$zpoolstatus" | { ! grep -qE "(DEGRADED|UNAVAIL)"; }
Here, the first printf is to make the data visible in
the web interface. The second one scans for any signs of failed
drives.
Docker
A custom script for docker checks that there are no “unhealthy”
services and adds the output of docker ps to the web
interface.
#!/bin/sh -eu
# see statusscripts/docker.sh
dockerinfo="$(LANG=en_US.UTF-8 docker ps)"
printf '%s\n' "$dockerinfo"
printf '%s\n' "$dockerinfo" | { ! grep -qF "unhealthy"; }
S.M.A.R.T.
A more complicated script monitors the drive health as reported by the hardware. Its basic form is as follows:
#!/bin/sh -eu
# see statusscripts/smartctl.sh
smartoutput="$(LANG=en_US.UTF-8 smartctl -H -A "$@")"
printf '%s\n' "$smartoutput"
printf '%s\n' "$smartoutput" | grep -qF ": PASSED"
Again, its the same pattern where the output is printed and the
return code indicates the success of the script’s execution. However, if
you look a the actual implementation in
statusscripts/smartctl.sh you may notice there is a quirk
to save the output of smartctl to a file. This is intended
to be used in conjunction with MDVL package mdvl-infobg to
display the S.M.A.R.T. attribute names.
Notifications
On non-interactive systems, Monit should be configured to send e-mail
reports in case of detected failures. This can be enabled by providing a
file like e.g. masysma-16-email under
/etc/monit/conf.d:
set mailserver smtp.example.com port 587
    username "machine@example.com" password "123456"
    using tlsv13
    with timeout 30 seconds

set mail-format {
    from: machine@example.com
}

set alert admin@exmaple.com
This settings configure the sender to be
machine@example.com (whose mail password is
123456) and the receiver to be
admin@example.com.
Monitorix
Links: https://www.monitorix.org/, Debian package monitorix
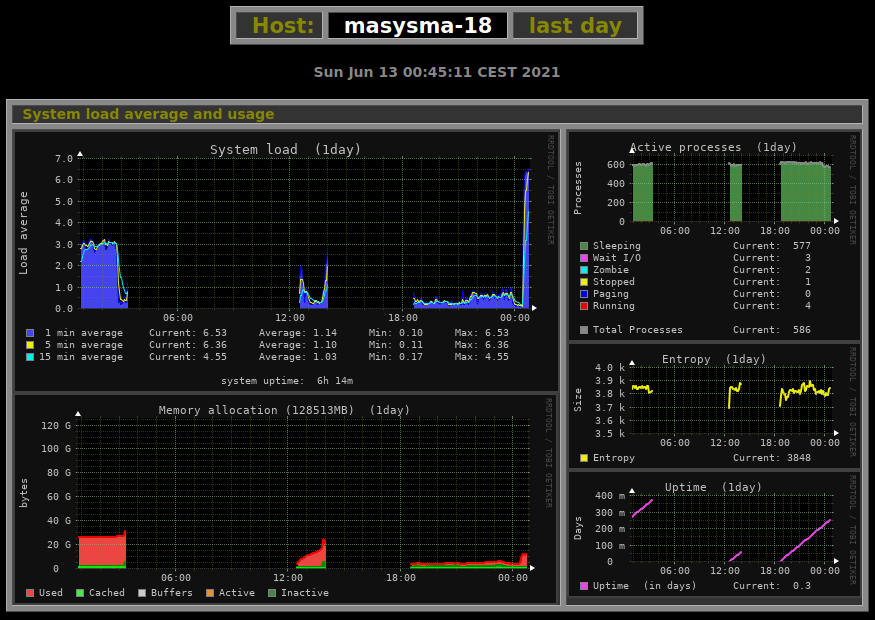
Monitorix is responsible for creating graphs and showing historic data. It does not display any text information, but provides a large number of graphs for different time intervals: day, week, month and year.
The Ma_Sys.ma configuration can be found as
70-masysma-default.conf in the repsitory. It keeps a lot of
graphs disabled by default to make sure that all of the graphs provided
by default are meaningful. If more graphs are needed, they can be
enabled by providing another file like
e.g. 80-masysma-18.conf under
/etc/monitorix/conf.d. The values from the second file will
then override the defaults from
70-masysma-default.conf.
A very nice property of Monitorix’ approach to the graphis is their simplicity:
- Data is stored in a fixed-size structure. Hence, it is impossible for the measurement values to eat up disk space or degrade processing performance from their growth.
- Graphis are created as image files on a static HTML page. This page
contains helpful comments for post-processing it. Should you e.g. want
to display graphs in public, that should be as easy as copying the
relevant graphs you want to show to a public location. Similarly, tools
like
mdvl-infobgcan query the graphs and process them, too.
Conclusion
So far, the new monitoring scheme has flawlessly been active for a month. The only issue that monit reported was a high load on a non-interactively used system during the transfer of a large backup.
Both tools: Monit and Monitorix seem to be capable of running un-attendedly for long periods of time and that is their important advantage over more powerful and more complex systems. Also, while it required a lot of tweaking and some auxiliary scripts, the configuration is easily versioned as small text file (snippets) in repositories.
Future Directions
It would be really nice if a check for the system’s patch level could be inlcuded in Monit, i.e.: Are the most recent security updates installed?
Neither Monit nor Monitorix incorporate information from the various
system logs. logwatch is used for this on non-interactive
systems, but it might be interesting to explore, if some of the
important functions of logwatch could be integrated by
means of custom Monit scripts?
Short note on getting to run Cacti
For Ma_Sys.ma monitoring purposes, Cacti was found to be too complex. Its installation procedure was tried and it roughtly consists of the following steps and components.
MySQL
CREATE DATABASE <database>;
USE <database>;
CREATE USER <user> IDENITFIED BY <password>;
GRANT ALL PRIVILEGES ON *.* TO <user>;
GRANT SELECT ON mysql.time_zone_name TO <user>;
mysql -u root -p cacti < /usr/share/doc/cacti/cacti.sql
mysql_tzinfo_to_sql /usr/share/zoneinfo/ | mysql -u root mysql
PHP
provide DB connection in config.php
/etc/php/7.3/cgi/php.ini date.timezone=Europe/Berlin
/etc/php/7.3/cli/php.ini date.timezone=Europe/Berlin
GUI
admin/admin -> admin/_0FAIL0_
Theme: Sunrise
OS
# Temporary, revert after installation?
chown www-data:www-data -R /usr/share/cacti